Restaurant POS benchmark software

Turn personalized benchmarks into winning restaurant strategies

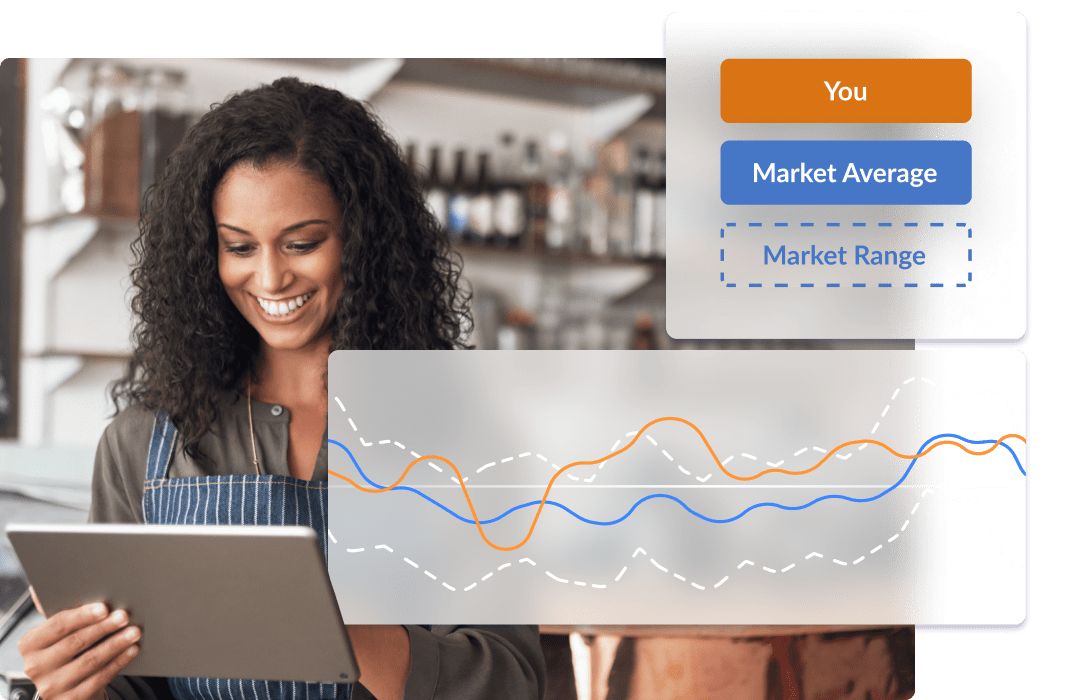
Lightspeed Benchmarks & Trends empowers you to outperform the competition that matters—yours—with relevant benchmarks that go beyond general industry averages.

Personalized benchmarks

Know how your restaurant stacks up against similar restaurants in your market for more meaningful and actionable insights.

Spot new opportunities

Uncover your untapped potential and where you can improve—whether it’s adjusting your menu, pricing strategy, hours or staff training program.

Streamline operations

Compare key performance metrics against your competitors to boost efficiency, cut costs and improve the guest experience.

Make data-backed decisions

Go beyond your gut feeling. Leverage market and competitor insights to make informed decisions for sustainable growth.

Maximize success with actionable sales and menu insights.

Better understand your sales, menu and competitors, so you can make informed decisions to drive better results.

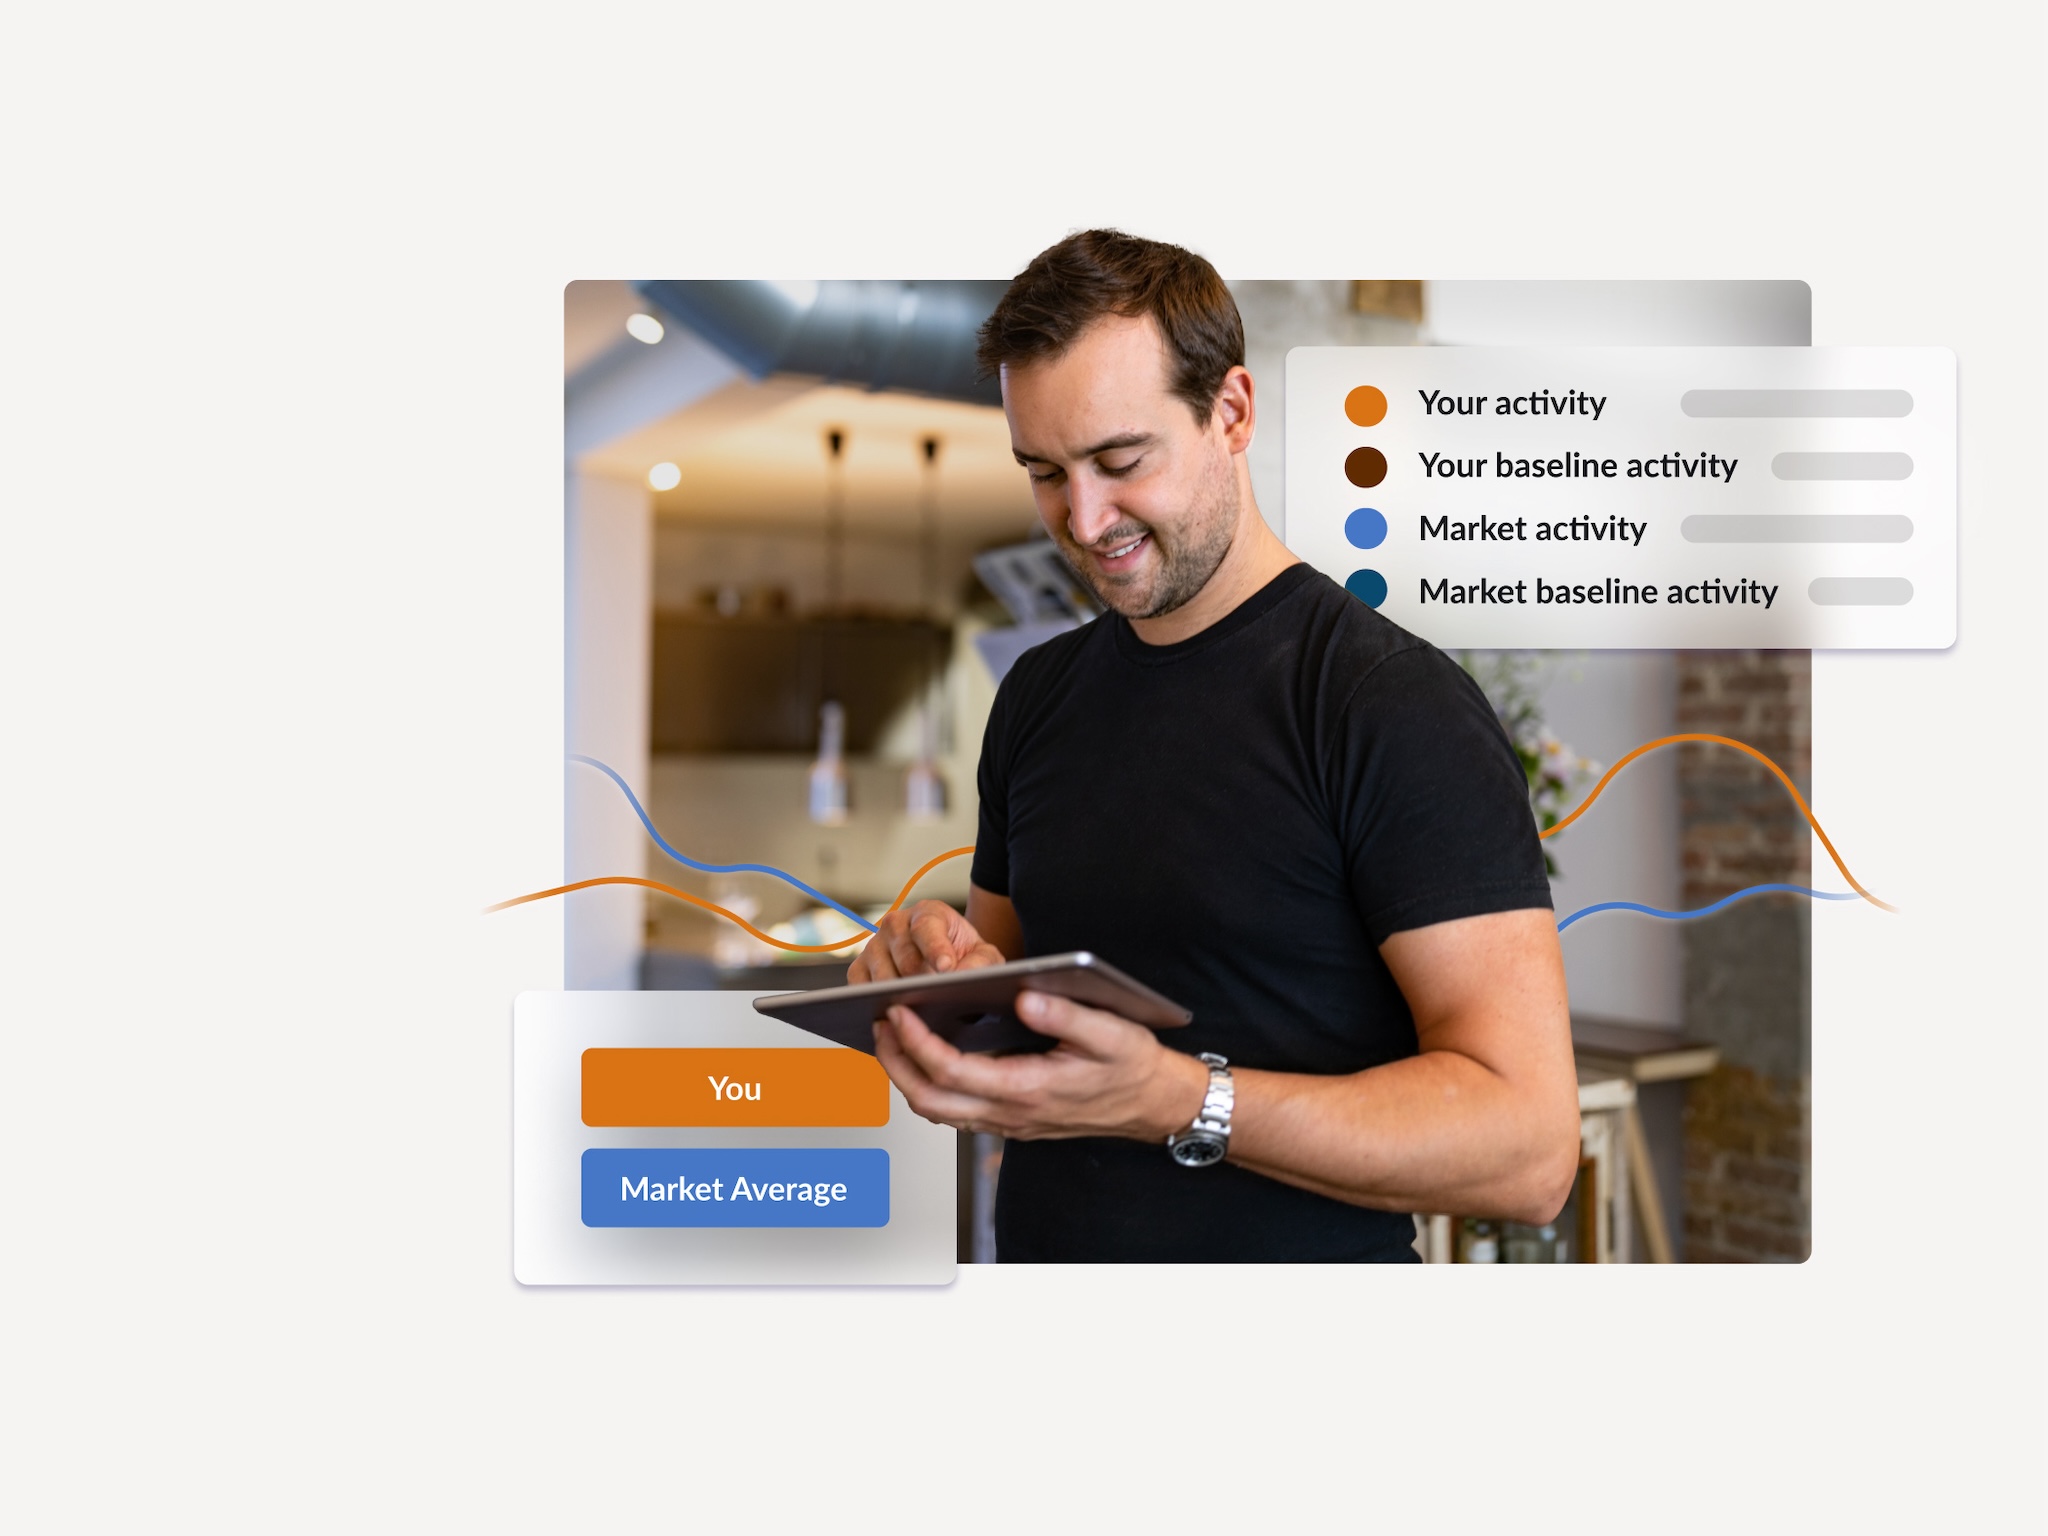
  • Know if you’re selling more or less than the market average—compare sales data by hour, day, week or month
  • Understand where your revenue comes from and where to focus your efforts
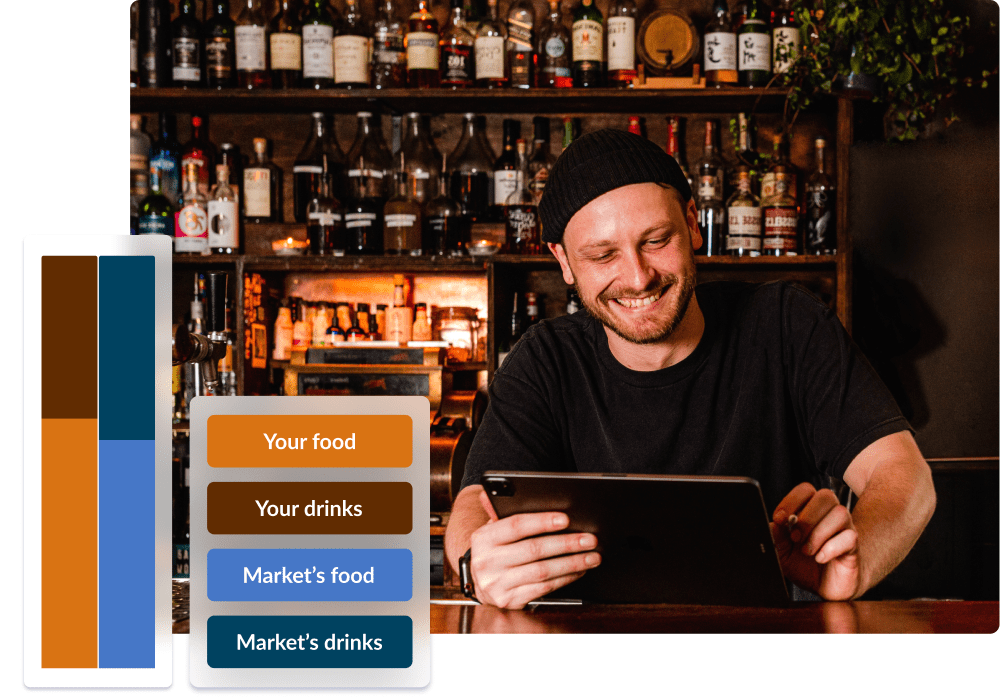
  • Compare your food and drink prices against the local market, so you can optimize your pricing strategy
  • Understand if sales fluctuations are market-wide or if there are underlying issues with your menu, pricing or service
A man at a bar uses a tablet, with overlaid charts comparing food and drink sales between his business and the market.

Enhance service and operational efficiency.

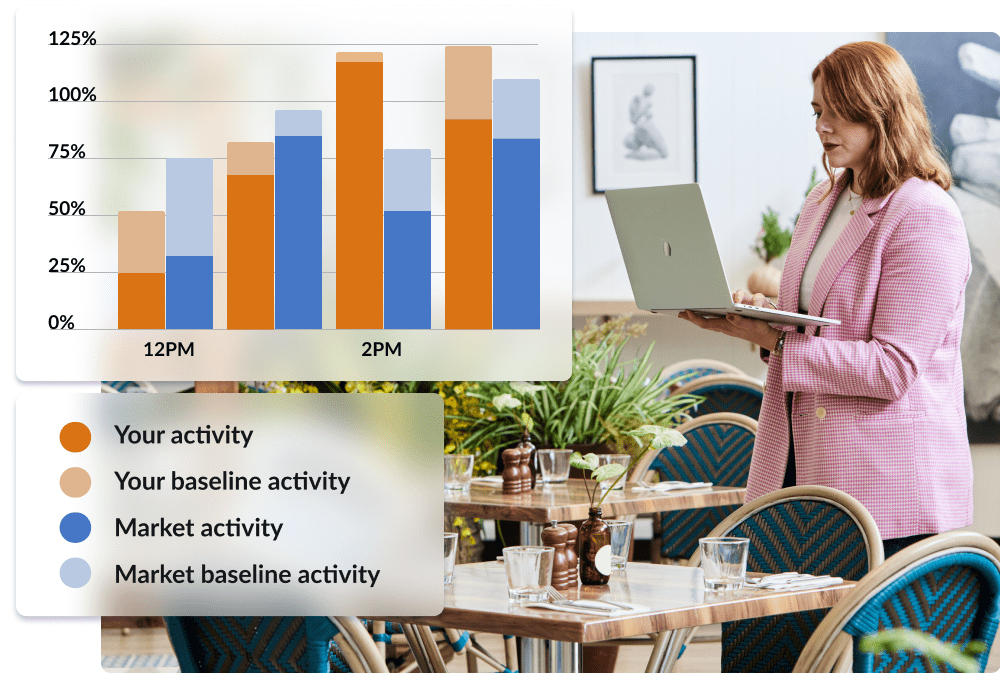
Learn how your service stacks up and where you can improve with hourly sales data and key performance benchmarks.

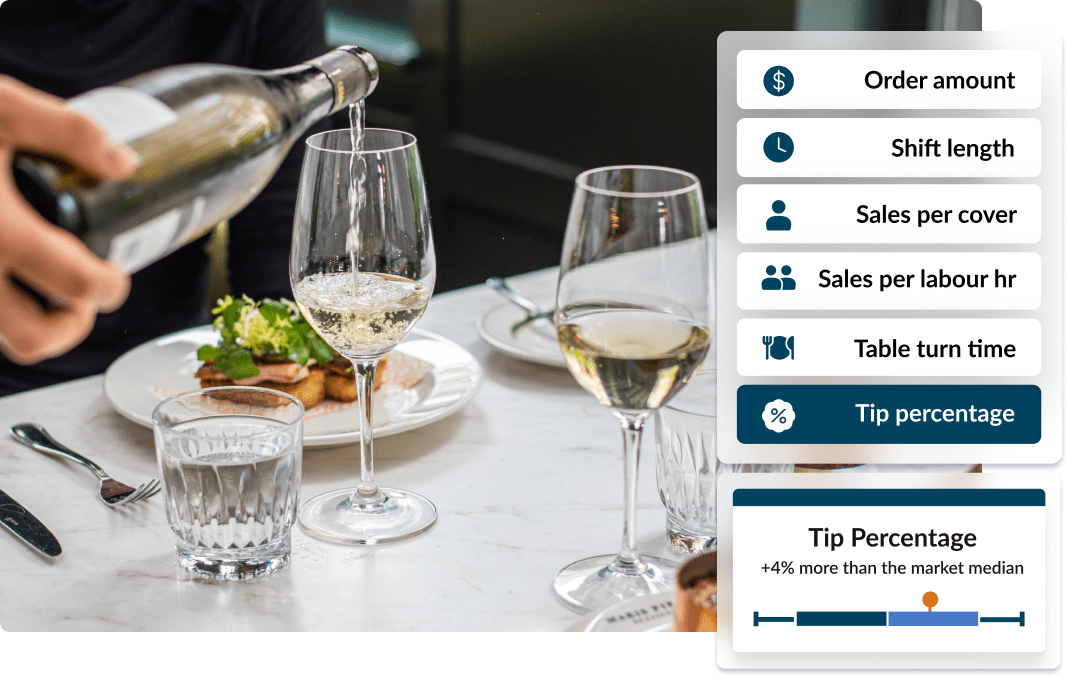
  • Diagnose inefficiencies at a glance with insights into table turn times, average shift length and sales per labor hour
  • Track sales per cover to identify upselling opportunities and increase check average
  • Identify peak hours to optimize staffing and cut unnecessary labor costs
  • Get a pulse on guest satisfaction by comparing your average tip percentage against the market's
A person pours wine at a restaurant table, with overlaid metrics tracking order amount, shift length, sales, table turn time, and tip percentage compared to the market median.

Stay ahead of trends and uncover opportunities.

Lightspeed Benchmarks & Trends empowers you to stay agile, capitalize on trends and plan for long-term growth.

  • Be ready to quickly adapt your menu, pricing or promotions to give your customers what they want, when they want it
  • Compare your peak hours to the market average and make strategic adjustments
  • Anticipate changes in demand and plan inventory and staffing to maximize success
  • Easily understand your data and market insights with smart graphs and summary cards
A woman uses a laptop in a restaurant, with overlaid bar charts comparing her activity and market activity over time.
A woman uses a tablet with overlaid graphs comparing her performance to market data and range.

See Lightspeed Benchmarks & Trends in action

Considering the switch to Lightspeed?

Switching to Lightspeed is easy. From data migration to hardware and payments setup, our industry experts will support you each step of the way.

  • Get fast 24/7 support
  • One-on-one onboarding
  • Dedicated Account Manager to answer every question
customer service agent wearing headset standing beside a computer monitor

FAQs

What are “personalized benchmarks”?

Personalized benchmarks refers to restaurant benchmark data that defines your “market” by more than just concept type and location. Instead of comparing your pub, for example, to every other pub in your region, Lightspeed compares your pub to other pubs in your area that also share other key characteristics that can impact your KPIs.

Why? Because painting with a broad brush can skew benchmark data and provide an incomplete picture of your true performance. That’s why Lightspeed offers an apples-to-apples comparison for more meaningful and actionable insights.

How does Lightspeed define “market”?

Lightspeed classifies businesses into cohorts based on their concept type and the key metrics most important to those concepts. We then compare similar businesses within a relatively close proximity.

What data do you use for Benchmarks & Trends?

Lightspeed uses anonymized customer content data from Lightspeed merchants who are located within a close geographic range and operate within a similar concept type. To protect the privacy of your business, we’ve taken steps to ensure that all data shared within this product is fully anonymized, meaning no identifying details about your business are revealed.

What if I don’t want to be included in the market data?

You can opt out of sharing your data for Benchmarks & Trends by selecting "opt out of market data" in the Benchmarks & Trends module. However, this also means you will no longer have access to Benchmarks & Trends, as participation is essential to providing these insights.

How often is restaurant benchmark data updated?

Restaurant benchmark data in Lightspeed is updated daily.

Can I define my own “market”?

No, merchants cannot define their own market or classification in Lightspeed at this time. However, we are exploring this possibility for future enhancements to Benchmarks & Trends.

Why can’t I see Benchmarks & Trends in my Back Office?

Benchmarks & Trends is currently only available to merchants in the United States. It’s powered by data from Advanced Insights, so you must have Advanced Insights enabled to use it.

The good news is that Advanced Insights is free for all merchants on Lightspeed Restaurant (K-Series) using Lightspeed Payments. If you don’t have Advanced Insights in your Back Office but believe you should, please reach out to your Account Manager.

Benchmarks & Trends also requires a minimum number of Lightspeed merchants within your market. If the number of local merchants is below this threshold, you will be unable to access Benchmarks & Trends at this time.