Chances are that if you’re reading this, you want to improve your online store’s performance.
Good news: you’re in the right place.
Whether you’ve just launched your online store or have been selling online for a while, concrete insights are what’s going to help you grow.
Enter: Lightspeed Analytics eCom reports.
These reports help you dig deeper into either your retail store(s) or online store’s sales and identify trends unique to that channel—like how your sales trend over time and which regions generate the most sales.
Here are the five Lightspeed Analytics eCom reports we suggest using to unlock your online store’s full potential:
- Average basket size
- eCom sales trend in time
- eCom sales by day of the week
- eCom sales by ZIP code
- Taxes collected on eCom
Let’s dive in!
Before we dive in…
To really improve your eCommerce store’s performance, we suggest enabling the Channel sales dimension. Here’s how:
- Run your selected report.
- Under the Sale header, find the Channel dimensions.
- Hit filter or pivot as needed.
Once you’ve enabled this dimension, you unlock a whole new world of possibilities for growing your business online.
1. Average basket size report
Your average basket size is a measure of the average number of items sold per purchase. Without adding any additional filters, the average basket size report gives you the average for your whole business. If you enabled the Channel sales dimension, you can see the averages for your brick-and-mortar and online store independently.
Why this report matters
How should you position your products and upsells to your eCommerce clientele? Do they spend more or less online or in-store?
Your average basket size report gives you a baseline of how your different channels are performing in relation to each other; it’s a litmus test for your business. You should run it regularly—say, quarterly—even if you think you know the answer.
How to access the average basket size report
To access your average basket size report, just follow these five steps:
- In Lightspeed Analytics, navigate to your sales and inventory reports.
- Run the Recent Sales report.
- In the Sale Completed Date filter, expand the range to encompass the last three months.
- Find the Channel dimension and add it as a pivot. Under the Measures dimension, there is an Avg. Basket Size measure; add it as well.
- Hit Run in the top right corner to generate the report with your new variables.
Editor’s note: For a more detailed walkthrough of this report, head to our in-depth community post on how to run an average basket size report.
For example
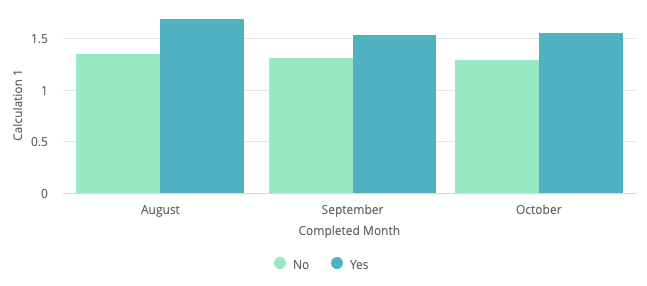
In this example, we ran the report from August to October 2019; the light blue column represents our brick-and-mortar store’s average basket size while the dark blue is our online store’s average basket size.

Our report shows us that our online store’s average basket size is slightly higher than our brick-and-mortar store.
Now, what do we do with this information?
Perhaps we should give some thought to our brick-and-mortar strategy. Are our sales associates suggesting the right products to customers? Maybe we need to create more enticing point-of-purchase displays or rethink our store merchandising. Our average basket size report let us know where there’s an opportunity to grow.
Related read:
2. eCom sales trend in time report
This report gives you the big picture of your sales. You can use it to see how your online store’s sales are performing compared to your brick-and-mortar store.
Why this report matters
This report will let you know if your eCommerce store’s sales are trending upward, stagnating or declining compared to your in-store sales. With that intel, you can take action and figure out what’s causing the growth, stagnation or decline in sales.
There are three questions you can find the answer to using this report:
- Which channel is performing better?
- Which channel needs more attention?
- Did your in-store and online promotions lead to more sales on that channel?
How to access the eCom sales trend in time report
To see your trends, follow these three steps:
- Run the Recent Sales report.
- Select your desired date range in the sale completed date filter.
- Add your Channel pivot.
- Click Run to generate the report.
- Open up the visualizations and plot the data on a line graph to view.
Editor’s note: For a more detailed walkthrough of this report, head to our in-depth community post on how to run an eCom sales trend in time report.
For example
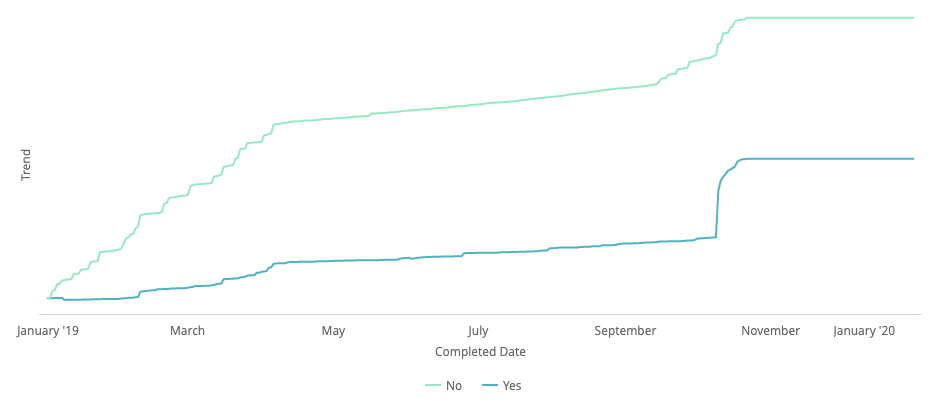
In this example, we can see that our in-store sales—the teal line—have been trending upwards, as have our online sales, represented by the turquoise line.

At the start of the year, our in-store sales trended upwards faster. Our fall sales are starting to see a spike in online activity, one more dramatic than our in-store sales.
Now, we can start thinking about what promotional efforts we were undertaking during those spikes. Were we focusing more on in-store sales and events during the beginning of the year? In the spring, our growth, while still positive, begins to slow—did we end any winter promotions that were doing well? Perhaps it’s time to bring them back.
We can also think about how our in-store and online strategies may be differing. What has caused our recently skyrocketing online sales? Can we replicate that activity in-store?
Make sense of your data (no math expertise required)
With Lightspeed Analytics’ easy-to-read reports, you don’t need to be a math whizz or Excel sheet superhero to use your data to grow your business.
3. eCom sales by day of the week report
While seeing how your sales trend over time is important for your big-picture strategy, a more granular report helps you figure out short-term growth plans.
Enter: The eCom sales by day of the week report.
Why this report matters
This is a relatively simple report that will help you with your promotional strategies.
Are there days of the week where you sell more than others? Do you have any lower-performing days? How consistent are your peak business days—do they change for certain times of the year (like before the holidays)?
By knowing what days your online store most active, you can time your in-store and online promotions better and maximize your sales resulting from those promotions.
How to access the eCom sales by day of the week report
To see your sales by day of the week, follow these four steps:
- Run the Recent Sales report from the sales and inventory reports section.
- Select your desired date range in the sale completed date filter.
- Add a day of week dimension for the sales.
- Add the Channel pivot.
- Run the report.
Editor’s note: For a more detailed walkthrough of this report, head to our in-depth community post on how to run an eCom sales by day of the week report.
For example
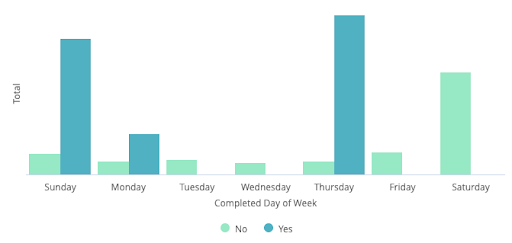
In this example, we can see that our online sales—represented by the dark blue column—are highest on Sunday and Thursday. Our in-store sales, represented by the light blue column, are highest on Saturday.

Sunday, Thursday and Monday are the days that we’re making sales online. This will inform what days we decide we should be posting promotional material on social media. Because Sunday and Thursday out-perform the other days of the week, we could try launching and promoting new products on those days.
Next, we should examine our lower-performing days. What could we do to boost sales? Consider flash deals, daily discounts and featured product promotion to bring the numbers up.
4. eCom sales by ZIP code report
Running this report will give you visibility into which geographic areas generate the most sales online store sales.
Why this report matters
This report helps you identify the most important markets for your business and subsequently think of ways to serve them better and further strengthen your sales.
For instance, if you’re thinking of opening another store location, you could consider setting up shop in the area where you’re generating the most online sales.
How to access the eCom sales by ZIP code report
To see which regions your online shoppers are located (and how much those regions are worth in sales), follow these five steps:
- Navigate to your sales and inventory reports. Run the Recent Sales report.
- Select your desired date range in the sale completed date filter.
- Under the customer filters, find the zip address dimension. Add it to the report as a filter and set it to is not null.
- Add your Channel dimension as a filter and set it to yes.
- Run the report and open up the visualization options to plot the data on a map.
Editor’s note: Currently, this report will only show you customers from the United States. For a more detailed walkthrough of this report, head to our in-depth community post on how to run an eCom sales by ZIP code report.
For example
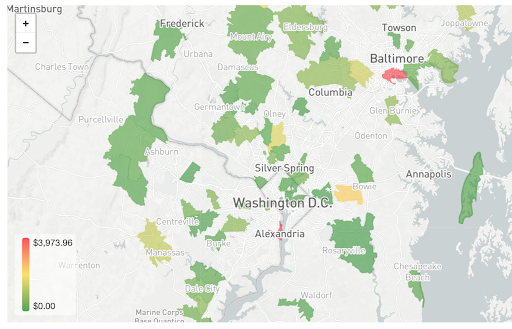
In this report, we can see a heat map of sales activity from the last 6 months. Red, orange and yellow areas have higher concentrations of sales—they’re hotter—while green areas have lower concentrations of sales.

It looks like Baltimore and Alexandria are generating the most online sales.
5. Taxes collected on eCom report
Running this report gives you data on the taxes your online shoppers are paying. This is an important report for any retailer based in the United States, in particular.
Why this report matters
Tax liability is one of the hardest parts of selling across multiple jurisdictions. If you’re based in the United States, your tax liability is based on where your customers are, not where your business is based.
Unless you’re willing to heavily restrict in which regions you service (which defeats the purpose of an online store in the first place), you’ll need to be prepared to organize and deal with transactions from shoppers in different jurisdictions.
How to access the taxes collected by eCom report
To see your taxes collected by eCommerce transactions, follow these six steps:
- Navigate to your sales and inventory reports. Scroll down to the additional reports and run the Tax Collected report.
- Adjust the sale completed date to the range you need—set it to be just after the last time you reported on your revenue.
- To see tax information about shoppers from the United States, add the Customer address field ZIP as a pivot.
- For tax information on online shoppers somewhere other than the States, add the country or city pivot instead.
- Add the Channel dimension as a filter. Set it to yes.
- Run the report.
This report is the easiest way to manage your tax liability. It’ll save you the time you’d otherwise have to spend combing through your sales. Run it regularly and make sure anyone who manages your business’ eCommerce sales data has access to the results as well.
Make reports work for you
Using concrete data to manage your eCommerce store leads to more effective sales strategies, smarter promotions and the potential to drive more revenue, both online and in-store.
Get in the habit of running these reports quarterly (at a minimum) to have the most comprehensive picture of your eCommerce activities.
Not using Lightspeed Analytics yet? Get in touch with our team of retail experts for a free, personalized consultation today!

News you care about. Tips you can use.
Everything your business needs to grow, delivered straight to your inbox.


